
fabric性能监控
使用Prometheus和Grafana来监测fabric。
1、修改docker-compose文件
参考链接:https://hyperledger-fabric.readthedocs.io/en/release-2.3/operations_service.html
修改fabric-samples/test-network/docker/docker-compose-test-net.ymal文件
配置orderer
在environment加入下面这一行。
      - ORDERER_OPERATIONS_LISTENADDRESS=0.0.0.0:8443
      - ORDERER_METRICS_PROVIDER=prometheus
配置peer
每个peer节点都配置,并且端口号不要重复,在environment处增加:
      - CORE_OPERATIONS_LISTENADDRESS=0.0.0.0:10443
      - CORE_METRICS_PROVIDER=prometheus
2、Prometheus配置
编辑prometheus.yml
# my global config
global:
  scrape_interval: 15s # Set the scrape interval to every 15 seconds. Default is every 1 minute.
  evaluation_interval: 15s # Evaluate rules every 15 seconds. The default is every 1 minute.
  # scrape_timeout is set to the global default (10s).

# Alertmanager configuration
alerting:
  alertmanagers:
    - static_configs:
        - targets:
          # - alertmanager:9093

# Load rules once and periodically evaluate them according to the global 'evaluation_interval'.
rule_files:
  # - "first_rules.yml"
  # - "second_rules.yml"

# A scrape configuration containing exactly one endpoint to scrape:
# Here it's Prometheus itself.
scrape_configs:
  # The job name is added as a label `job=<job_name>` to any timeseries scraped from this config.
  - job_name: "prometheus"

    # metrics_path defaults to '/metrics'
    # scheme defaults to 'http'.

    static_configs:
      - targets: ["localhost:9090"]
  - job_name: 'hyperledger_metrics'
    scrape_interval: 10s
    static_configs:
      - targets: ['orderer.example.com:8443','peer0.org1.example.com:9443','peer0.org2.example.com:10443']
编辑docker-compose.yaml
version: "2.4"

networks:
  test:
    name: fabric_test

services:
  prometheus:
    container_name: prometheus
    image: prom/prometheus
    restart: always
    ports:
      - 9090:9090
    volumes:
      - ./prometheus.yml:/prometheus.yml
      - ./prometheus_data:/prometheus
    command:
      - '--config.file=/prometheus.yml'
      - '--storage.tsdb.path=/prometheus'
      - '--web.console.libraries=/usr/share/prometheus/console_libraries'
      - '--web.console.templates=/usr/share/prometheus/consoles'
    networks:
      - test
启动服务
docker-compose up -d
端口转发9090本地(因为是远程服务器)
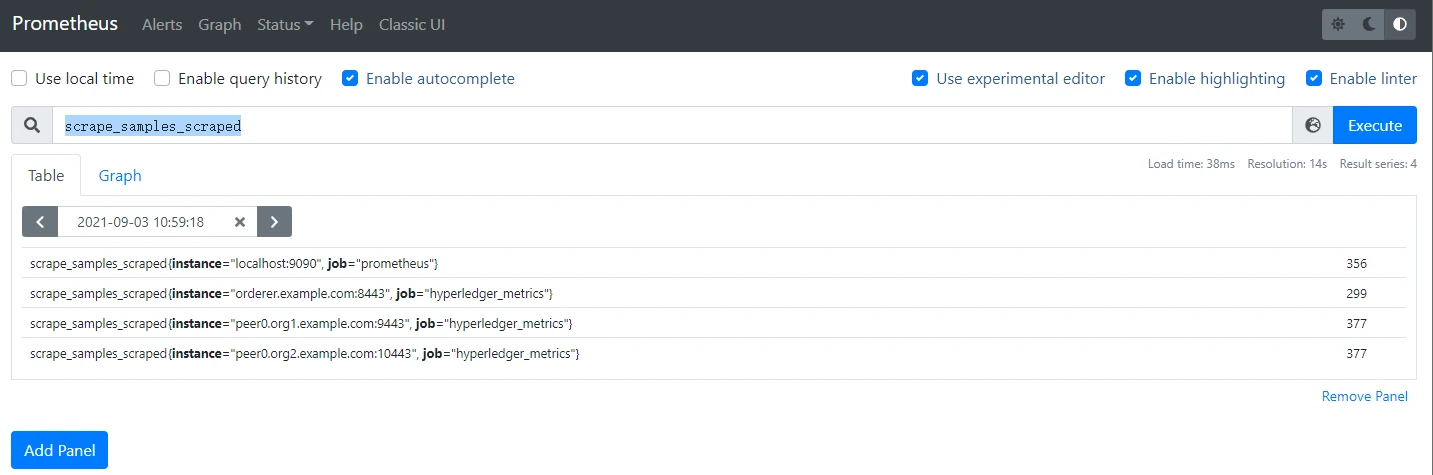
访问9090端口的prometheus,在输入框中输入scrape_samples_scraped,然后执行,就能看到有没有成功执行任务了。
3、Grafana配置
新建grafana目录
mkdir -p grafana/data
chmod 777 grafana/data
首次运行grafana
docker run -d --name grafana -p 3000:3000 grafana/grafana grafana
将配置文件拷贝至宿主机方便修改配置
docker exec -it grafana cat /etc/grafana/grafana.ini > grafana/grafana.ini
然后删除容器
docker stop grafana
docker rm grafana
修改grafana.ini,改改账户密码,端口,URL这些,也可以不动。
在Prometheus的docker-compose文件里再加上grafana的配置,最重要的是要挂载数据,否则每次重启都会丢失配置信息。
  grafana:
    image: grafana/grafana
    container_name: grafana
    restart: always
    ports:
      - "3000:3000"
    volumes:
      - ./grafana/grafana.ini:/etc/grafana/grafana.ini
      - ./grafana/data/:/var/lib/grafana
    networks:
      - test
    depends_on:
      - prometheus
启动
docker-compose up -d
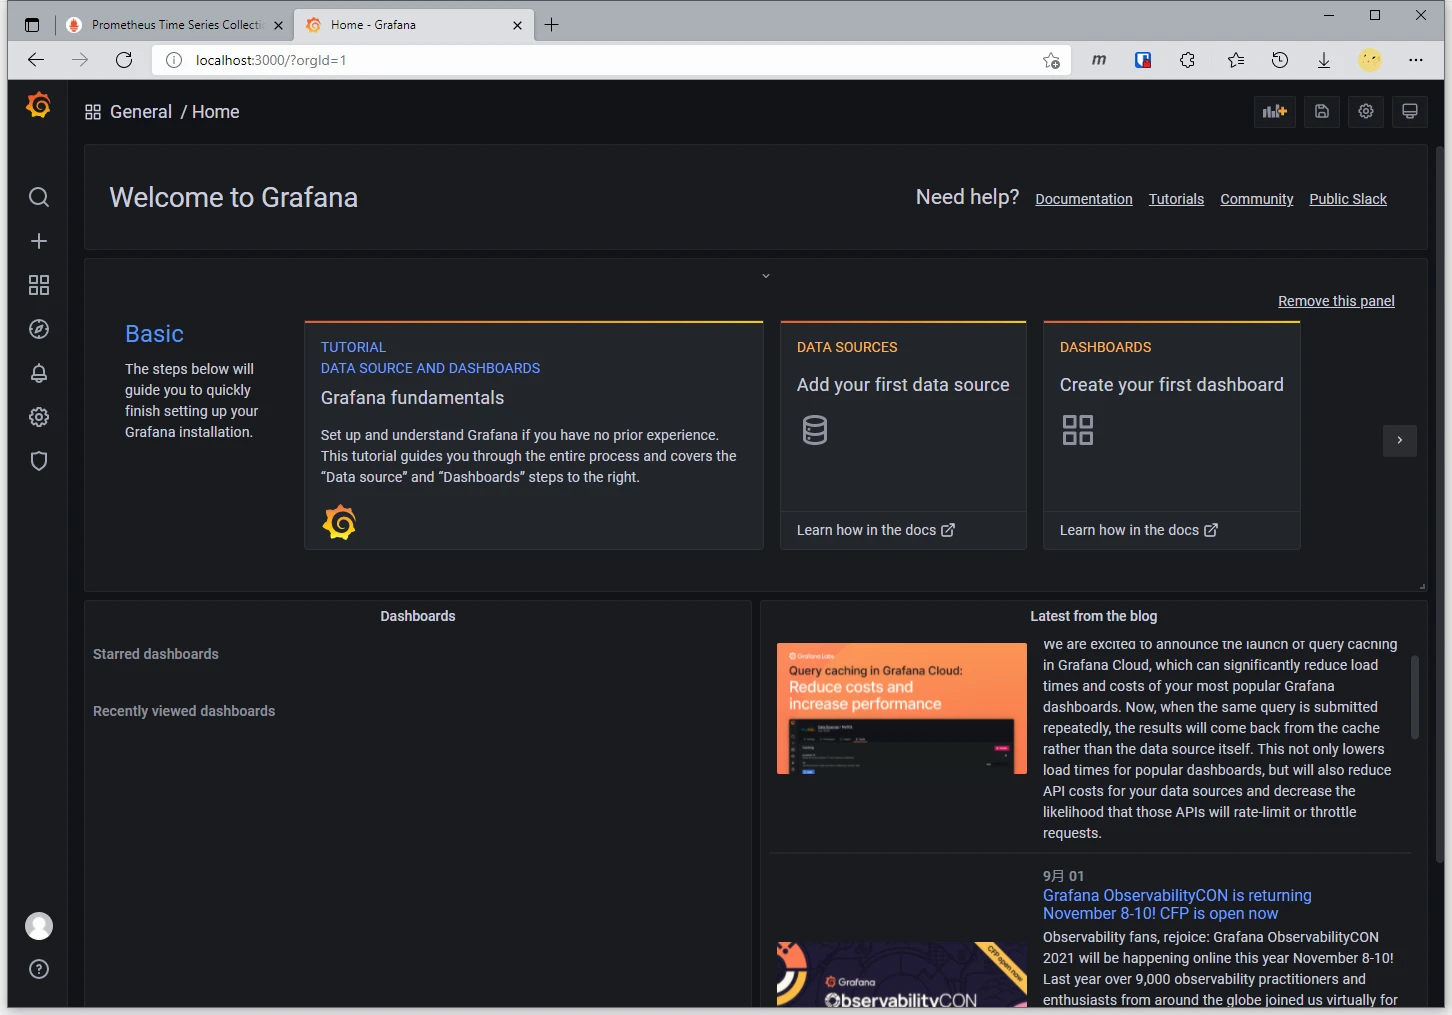
在3000端口访问,账户密码默认admin。
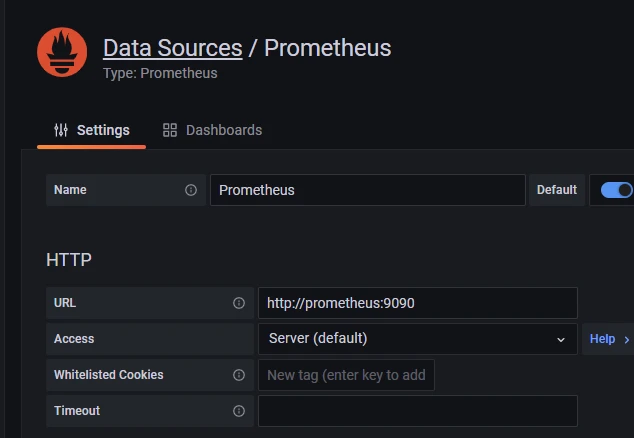
然后去左侧设置,选择添加Prometheus,url填写http://prometheus:9090 (因为Prometheus和Grafana都是通过docker运行的,两者只能通过网桥进行连接,两者的localhost都是在容器内的,而不是宿主机),然后拉到下面save & test,会显示Data source is working。
然后下载dashboard的样式,这里我下载了两个
一个是Hyperledger Fabric Monitoring for 1.4
然后点Grafana页面左侧的加号,Import任意一个json文件样式,就差不多了。
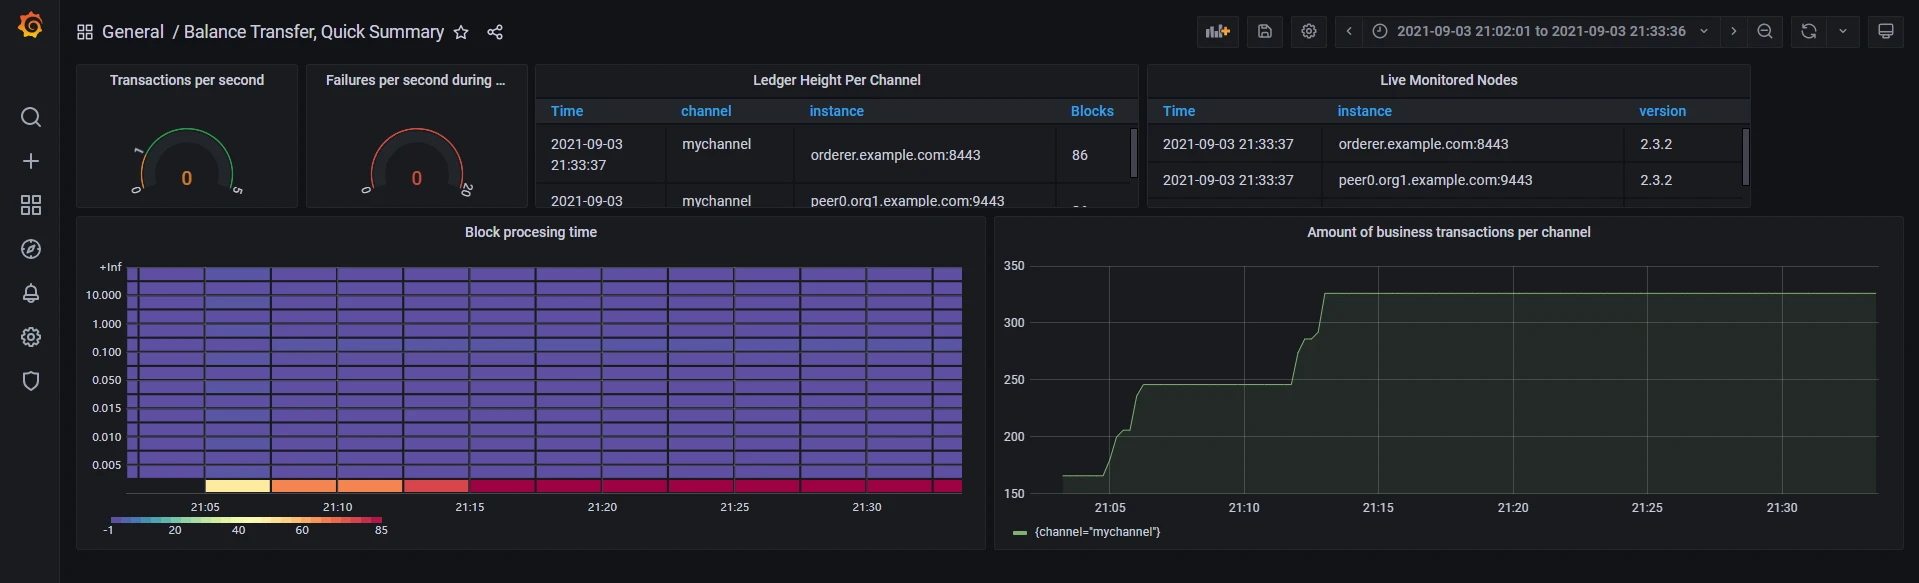
然后样式就可以进行edit,添加不同的属性,接下来靠自己摸索了。
其他配置
其他还有两个比较基础的,一个看设备状态,比如CPU,内存这些的,使用node-exporter。还有一个就是docker容器的状态,使用cadvisor,只不过这个只有老版本的,新版本的在谷歌仓库上,咱们下载不了,所以还是用docker官方仓库的老版本。
docker-compose.yaml
  nodeexporter:
    container_name: nodeexporter
    image: prom/node-exporter
    ports:
      - 9100:9100
    volumes:
      - /proc:/host/proc
      - /sys:/host/sys
      - /:/rootfs
    networks:
      - test

  cadvisor:
    image: google/cadvisor
    # privileged: true
    restart: always
    container_name: cadvisor
    volumes:
      # - /var/run:/var/run:rw
      # - /sys:/sys:ro
      # - /var/lib/docker/:/var/lib/docker:ro
      # - /cgroup:/cgroup:roZ
      - /:/rootfs:ro
      - /var/run:/var/run:ro
      - /sys:/sys:ro
      - /var/lib/docker/:/var/lib/docker:ro
      - /dev/disk/:/dev/disk:ro
    ports:
      - 8080:8080
    networks:
      - test
prometheus.yaml
  - job_name: 'cadvisor'
    scrape_interval: 5s
    static_configs:
      - targets: ['cadvisor:8080']

  - job_name: nodeexporter
    scrape_interval: 5s
    static_configs:
      - targets: ['nodeexporter:9100']


